Case Study — Radial Chart Micro-Service API

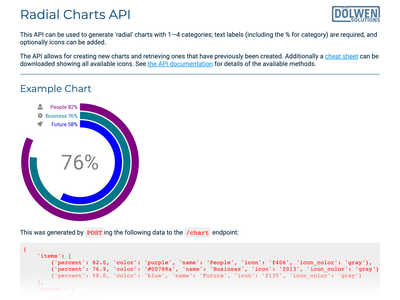
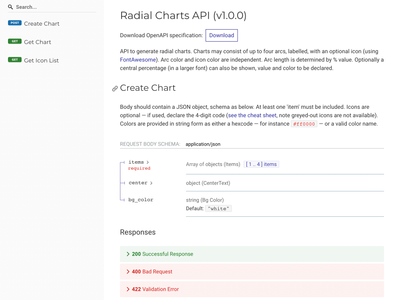
The brief was to provide an API for generating 'radial charts'. Specifically:
- chart up to 4 values (0-100%) as concentric circles
- each line can optionally have a label with value, text and an icon
- optionally a % can be displayed in the centre of the circles
- circle colours, chart background colour, and icon types all customisable
- image of the chart generated by
POST-ing to an API endpoint - each image created is saved "to the cloud" with a unique reference/URL
- URL for image is included in the
POSTresult - (static) image can be accessed/included in a document or website using the URL
Technical Stack

The final system design was:
- API written in Python using FastAPI
- deployed to Deta Space (sadly now shut down) for both the API/documentation and database
Benefits
The benefits of this solution are:
- FastAPI provides a lightweight, high-performance Python-based framework specifically designed for developing and deploying APIs.
- Quick and cheap deployment on your choice of Platform as a Service (eg Render, Railway)
For more information or to discuss a project, please email [email protected].